Data Visualization for Boards: How to Present KPIs and Metrics for Maximum Impact and Oversight
How data is presented matters as much as what data is presented. Effective data visualization is the bridge between raw information and actionable insight. When done right, executive dashboards enable board members to grasp complex performance patterns instantly, ask better questions, and provide meaningful oversight. When done poorly, they create confusion, erode confidence, and waste everyone's time.
This article outlines how to design KPI dashboards and visual reports that support oversight and better board-level decisions.

The Strategic Purpose of Board-Level Visualization: Start with the Story, Not the Data
The board’s mandate should guide what appears on the dashboard. Board members don't need to see every data point your organization tracks. They need to understand what's changing, why it matters, and what decisions require their attention.
Board members are part-time observers with full-time accountability. They need a high-level view that highlights the health of the organization without getting bogged down in operational minutiae.
The goal of executive dashboards is to answer fundamental questions:
- Where are we now? (Current performance vs. targets)
- Where are we going? (Forecasts and momentum)
- Where do we need to intervene? (Exceptions and risks)
If a chart doesn’t help a director answer one of these questions within ten seconds, it is likely adding noise rather than value.
Design for Clarity, Not Decoration
Your executive dashboards should be clean, consistent, and immediately comprehensible. Avoid forcing directors to hunt for problems. If a KPI is off track, the visualization should make that immediately visible and prompt a focused discussion on implications and next steps.
Structure your reporting so the most critical information is at the top. Start with a "North Star" metric (e.g., EBITDA, or Customer Acquisition Cost), followed by supporting KPIs. This allows directors to quickly validate the overall strategy before diving into specific business units.
Label everything explicitly. Clear titles that state the insight, not just the metric name Board members may be reviewing materials at midnight before the meeting. They shouldn't have to guess what your axes represent or hunt for units of measurement. Every chart needs a clear title, labeled axes, and a legend if you're showing multiple data series.
Eliminate chartjunk. Remove gridlines unless they're essential for reading values. Delete borders, shadows, and gradients. Dump the 3D effects entirely. These decorative elements don't add information; they subtract comprehension. Simple charts over complex visuals When in doubt, choose clarity over creativity.
Use consistent color coding across all materials. If green means "on target" in one chart, it must mean the same thing in every chart. Establish a color palette that aligns with your brand but prioritizes clarity over aesthetics. Color is a powerful tool for board oversight. Limited color, used intentionally to signal risk or change Use Red-Amber-Green (RAG) indicators to direct attention.
- Green: On track.
- Amber: Near threshold; requires monitoring.
- Red: Significant variance; requires a formal mitigation plan.
- Use icons or patterns as backup indicators for members who may be colorblind.
Provide Context and Pair Visuals with Interpretive Commentary
A single data point rarely tells a useful story. Boards need context to assess performance and risk. Context transforms metrics into insight and supports meaningful board oversight. A KPI that says "Revenue: $47M" is meaningless without comparison. Is that good? Show the target, show last year's figure, show the trend. A revenue chart that shows three years of performance against a plan is far more valuable than a single-quarter snapshot.
Every visual should be accompanied by a brief executive summary that explains variances and outlines next steps. Boards benefit from brief, plain-English interpretation that explains why performance changed and what management is doing about it. Data tells you what happened; management must explain why.
Effective board reporting pairs each key visual with:• One or two sentences explaining the main takeaway
• A concise explanation of drivers
• A clear indication of whether board action or awareness is required
By providing context and pairing visuals with interpretive commentary the risks of misinterpretation or unnecessary deep dives are reduced and meetings are kept efficient.
Common Mistakes That Undermine Board Oversight
Even well-intentioned dashboards can undermine board effectiveness if these pitfalls are not addressed:
- Misleading Scales: Starting a Y-axis at a non-zero number can exaggerate small fluctuations, leading to unnecessary panic or false confidence.
- Decoration over Communication: Avoid 3D pie charts, overly busy backgrounds, or "cute” icons. In a professional setting, minimalist design is always more authoritative.
- Dumping Data: Presenting forty slides of charts because you're afraid of leaving something out guarantees that board members will miss what's important. If everything is highlighted, nothing is. Fewer metrics, clearly explained, lead to better questions and better governance.
- Inconsistent Presentation: Changing how you present information from quarter to quarter makes it impossible for boards to spot trends or hold management accountable. While refinement is healthy, constant changes erode trust and make trend analysis difficult. Establish a consistent dashboard format and stick with it unless there's a compelling reason to change. Stability in board reporting supports stronger governance.
- Vanity Metrics: Focusing on metrics that look good rather than metrics that matter is a fast track to irrelevance. Your board needs leading indicators that predict future performance, not lagging indicators that make the past look pretty.
- Font Size Failure: If board members need reading glasses to see your charts, you've failed. Text should be large enough to read comfortably on a projected screen from the back of the room.
- Missing the Denominator: Showing "500 new customers" without showing "from 50,000 leads" hides conversion rate problems
- Trend Lines Without Time Context: A six-month trend looks very different than a five-year trend with the same slope
Matching the right visual to the specific type of data is crucial for clarity.
|
Metric Type |
Recommended Visualization |
Why it Works |
|
|
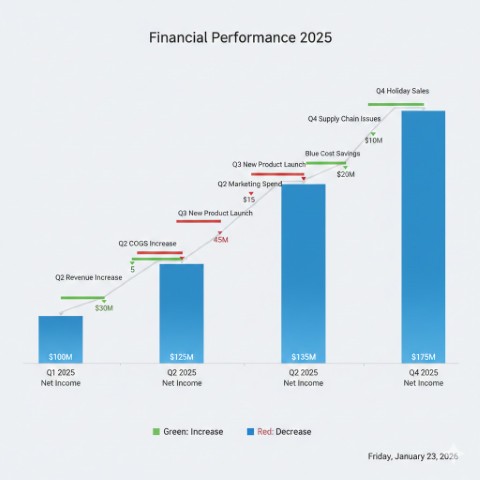
Financial Performance |
Waterfall Charts |
Clearly shows how you got from Point A to Point B by highlighting gains and losses. |
 |
|
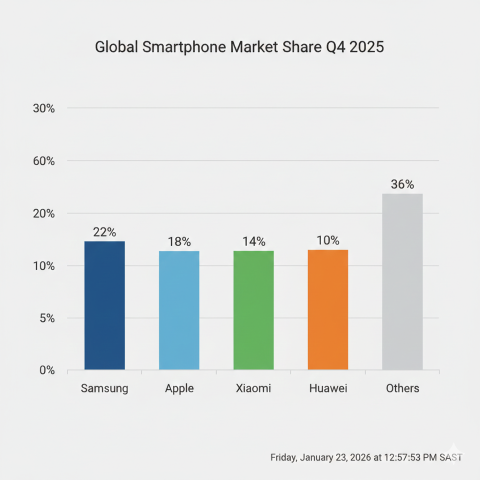
Market Share |
Bar Charts |
Bar charts excel at comparisons across categories. Horizontal bars often work better than vertical ones when you're comparing many items or when category labels are long. |
 |
|
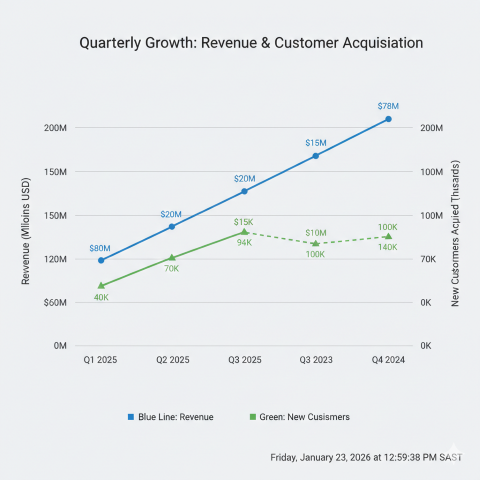
Revenue Growth |
Line Charts |
Trend lines work best for showing performance over time. Use them for revenue growth, customer acquisition, or any metric where the trajectory matters as much as the current number. Avoid cluttering these with too many comparison lines. |
 |
|
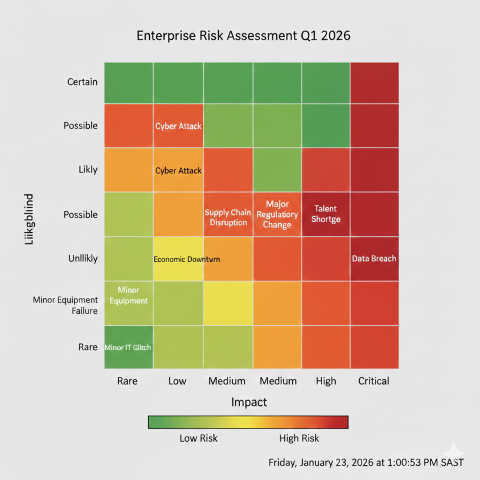
Risk Assessment |
Heat Maps |
Heatmaps can surface patterns across multiple dimensions quickly. They're valuable for showing performance across a matrix—say, customer segments by product categories—but require a clear legend and careful color selection to avoid confusion. |
 |
|
Use Sparingly |
Pie charts |
Use them only when showing parts of a whole where the differences are significant. Never use them for more than five segments, and never use 3D effects, which distort perception. |
 |
|
Precise values that need comparison. |
Tables |
Limit them to what's essential. If your board packet includes a table with more than seven rows or five columns, ask whether a visualization might work better. |
Conclusion: Make It Actionable
Well-designed KPI dashboards align management and boards around shared priorities, surface emerging risks early, and enable more disciplined oversight. When boards can see clearly, they can govern effectively.
The ultimate test of effective data visualization for boards is whether it drives better decisions. Every chart should either confirm that the organization is on track or highlight where intervention is needed. End each section of your board reporting with clear implications and, where appropriate, specific recommendations.
In the boardroom, time is the most precious commodity. Don't waste it on clever graphics or exhaustive detail. Give them clarity, context, and the insights they need to govern effectively. That's how data visualization creates value that justifies the cost of having everyone in the room.